


This new feature in ARC allows the user to filter for specific diseases across the population. Meaning, the user can now see data on the page specific to a population of members with that chronic disease.
Below is an example of the drop down and the available chronic disease options.
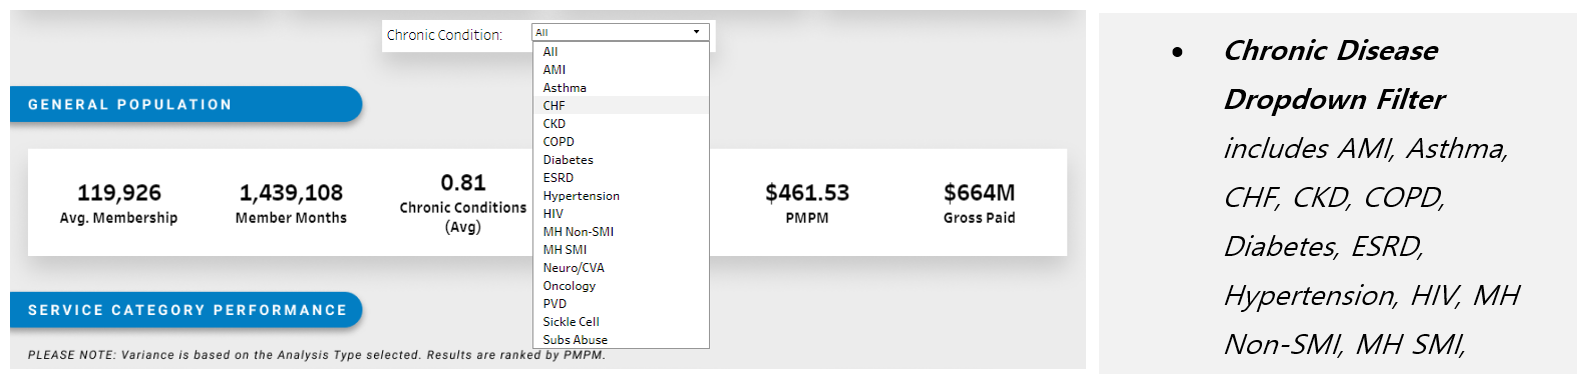
The filter is available in the following views: Comparison, Cost & Use, ED, Inpatient, Network Performance, Pharmacy, Population Overview, PCP & Practice, Specialist Performance, Specialty, and System Overview
Potential Use Cases
Multiple ARC views and features can be applied to derive opportunities related to chronic conditions. The filter helps users to understand the impacts of illness across service categories and providers for a more comprehensive view of chronic condition impacts and patterns relating to cost and utilization. The examples below show how best to apply these into daily work and business planning to draw insights and identify areas of focus.
Identifying Avoidable Utilization: The Network Performance dashboard provides users with a snapshot of multiple cost and utilization rates for members by an attributed practice.
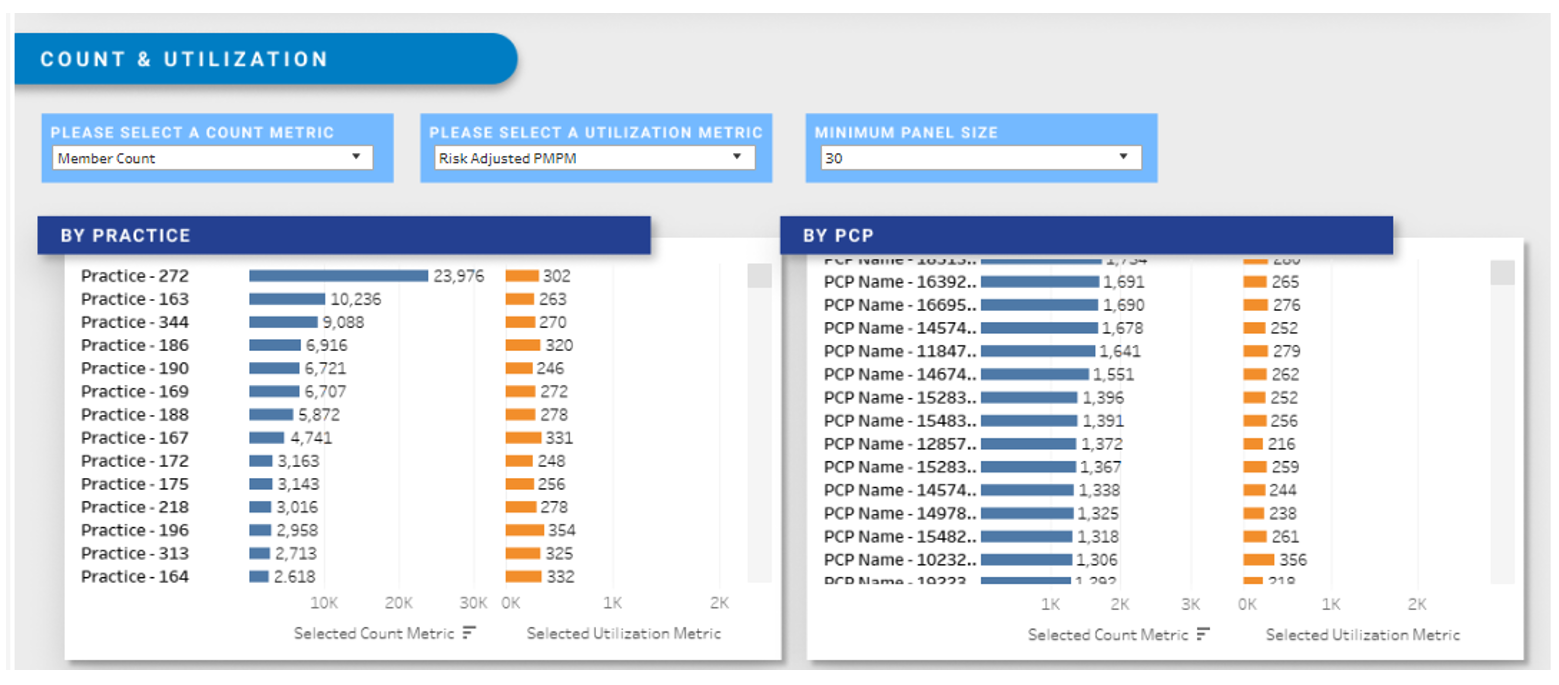
Users can also view a comparison of key performance metrics for a provider against the product adjusted panel performance. The metrics include count metrics, utilization metrics and panel size. When filtering for chronic conditions, users will be able to compare and assess the impact of chronic disease on provider performance rates relative to their peers.
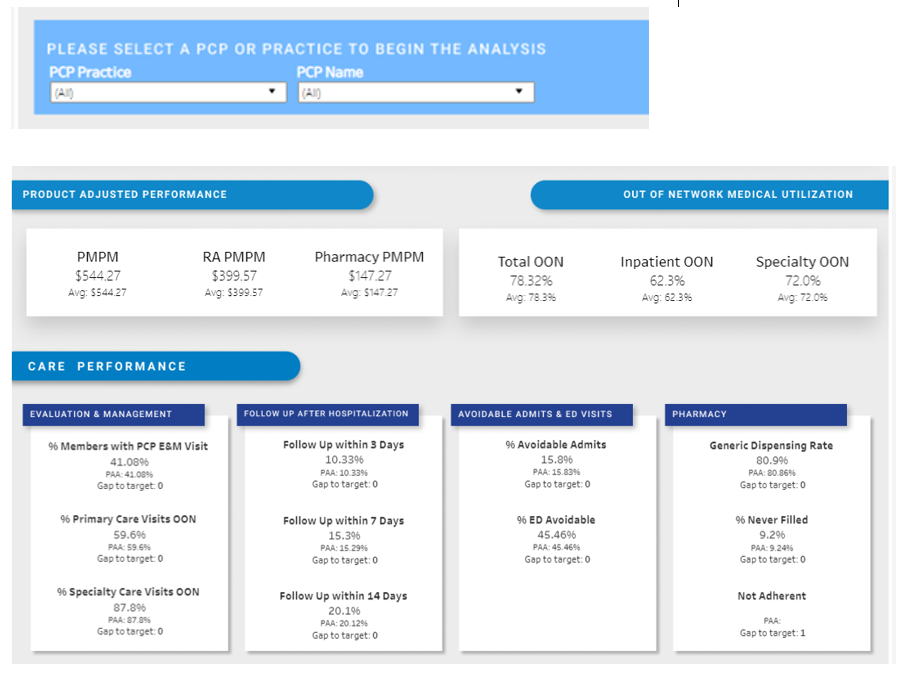
The PCP and Practice dashboard provides users the opportunity to analyze individual PCP and Practice performance across a variety of quality measures while comparing to their product adjusted peer group.
- This view provides a PCP/Practice population overview, OON metrics utilization, and opportunities for gap closures, that include member level detail. Once at the member level detail, users can download the member list and begin an analysis to identify members for targeted initiatives across chronic diseases.
Specialty Economic Profiling: The Specialty dashboard allows users to apply various filters and analyze sortable data to explore utilization patterns and uncover potential opportunities for improvement by service line.
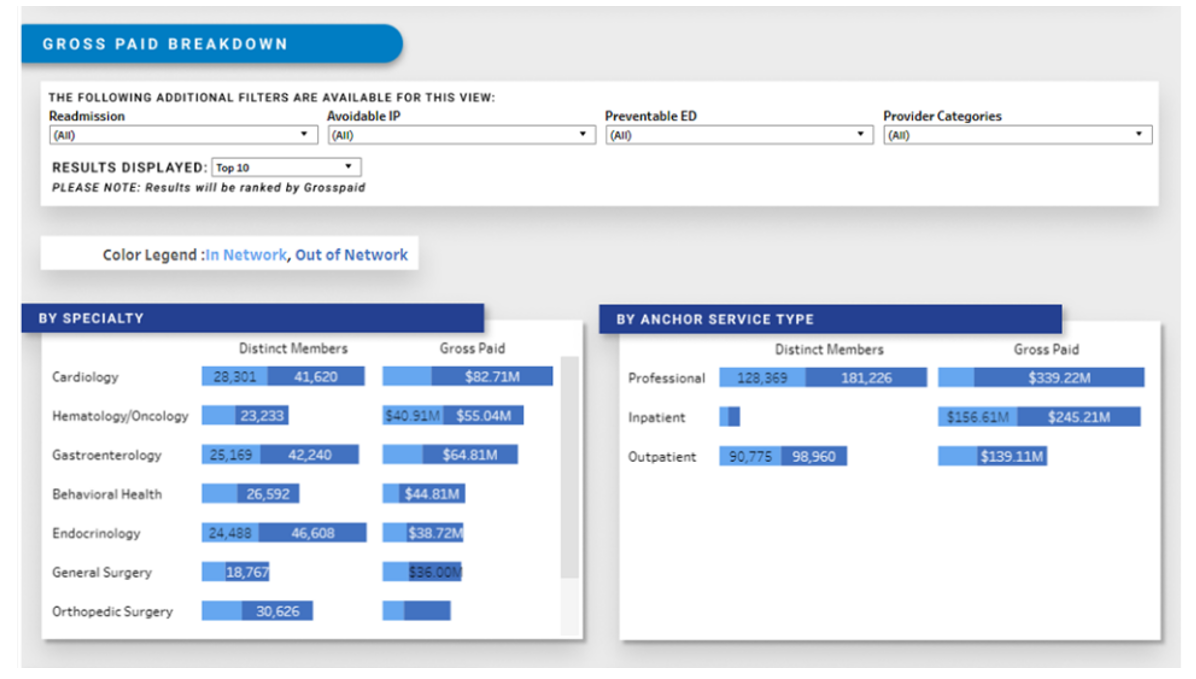
- This table lists every specialty (anchor service line). Users can see the gross paid amount for both IN and OON. Additional filters include: Readmission, Avoidable IP, Preventable ED, and Provider Categories. This allows users to view spend trends as well as the total impact of utilization patterns.
- This view is intended to help identify outliers amongst physicians and produce actionable insights across the network and chronic conditions.
- By filtering on chronic conditions, users can identify the impact of underlying conditions on specialty and out of network usage and/or connect chronic illness and specialty care gaps if applicable.
For more information, please contact info@copehealthsolutions.com.